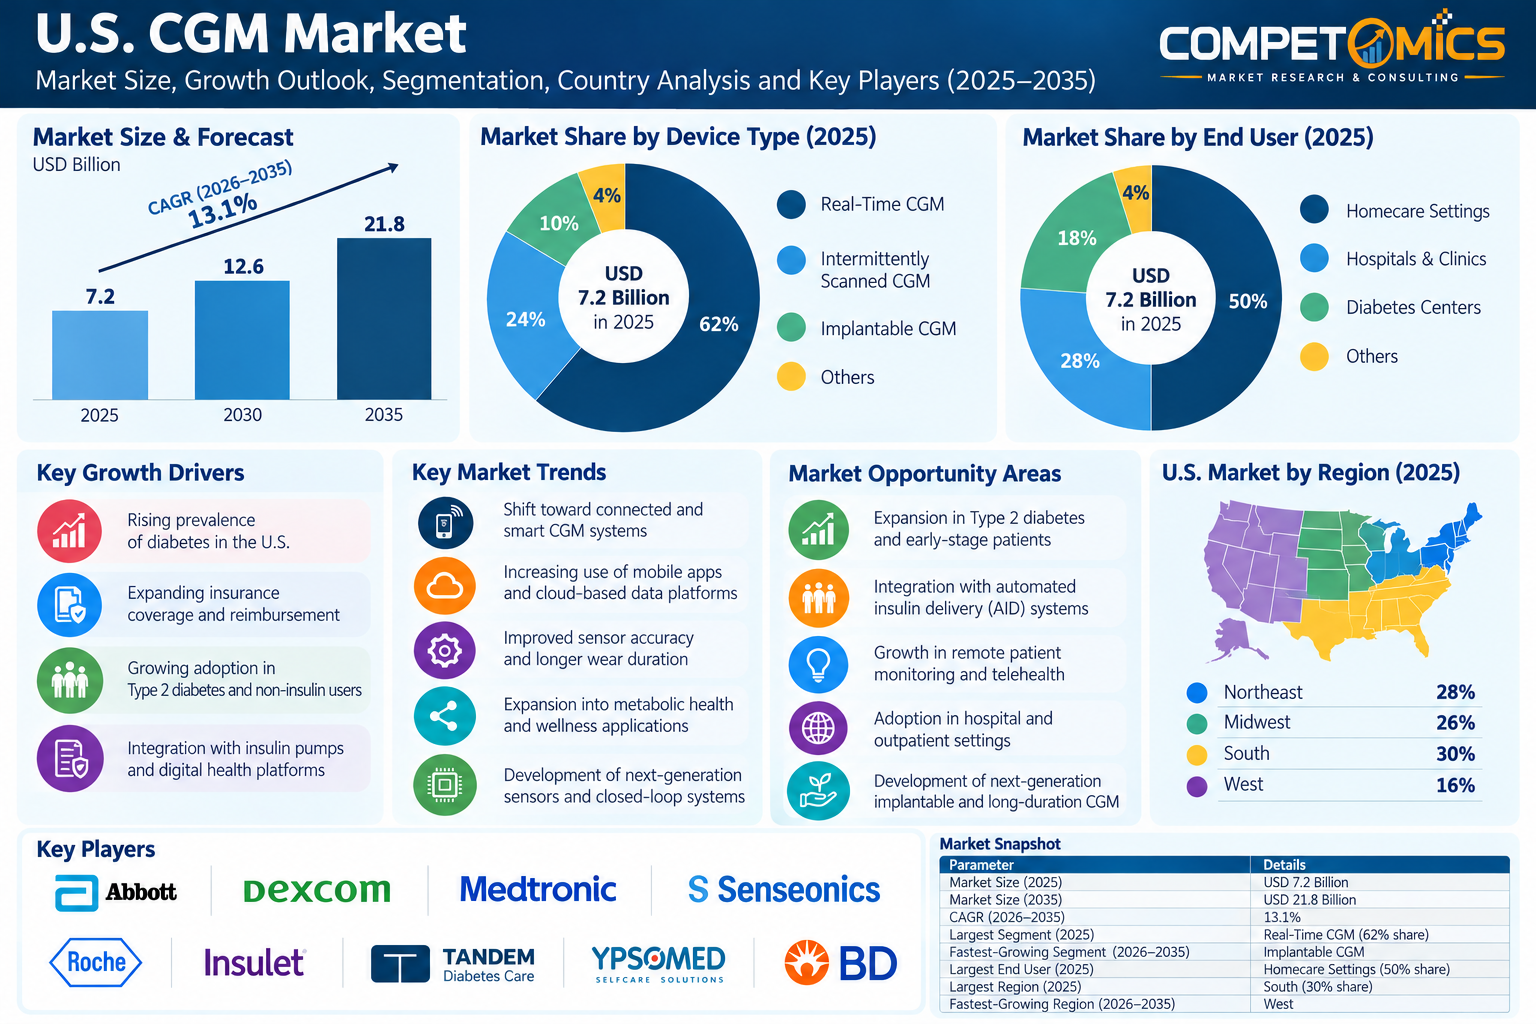
U.S. CGM Market was valued at USD 7.80 billion in 2025 and is projected to reach USD 23.15 billion by 2035, expanding at a CAGR of 11.5% during 2026–2035. Market expansion is supported by structural demand, technology adoption, increasing healthcare utilization and the need for more convenient, effective or connected solutions. Key opportunities include broader reimbursement and patient access, integration with digital health and automated insulin delivery, and longer-wear, lower-cost sensors and emerging type 2 use.
MARKET VISUALS
Market Overview & Sample Analysis
MARKET VISUALS
Market Overview & Sample Analysis
MARKET VISUALS
Market Overview & Sample Analysis
By Product Type
Sensors are the largest product component because recurring sensor replacement creates the principal revenue pool within CGM systems. Transmitters and receivers represent a smaller share as smartphone-based architectures reduce the need for dedicated hardware. Integrated systems are the faster-growing product opportunity because patients and clinicians increasingly prefer simplified configurations that combine sensing, connectivity and therapy-management capabilities. Longer sensor wear, smaller form factors and easier insertion are reducing friction and can improve adherence. Product competition is therefore moving toward total user experience, not simply measurement accuracy. Local reimbursement and procurement policies influence the mix significantly. In the U.S., broader payer coverage and consumer-oriented models support rapid expansion; in European markets, reimbursement and health-system procurement shape access; in China and Japan, domestic ecosystem development and local market access are increasingly important; and in South Africa, affordability remains a central constraint. The product segment will continue shifting toward integrated, smartphone-connected and lower-maintenance systems.
By Technology
Electrochemical sensing remains the commercial technology foundation because it combines established accuracy with scalable manufacturing and regulatory familiarity. The fastest-moving technology layer is connected CGM, where sensors automatically transmit readings to smartphones and cloud platforms. AI-enabled trend interpretation, alerts and predictive analytics are expanding the value of raw glucose data. Interoperability with insulin pumps is another major growth driver because CGM becomes a control input for automated insulin delivery. Longer-wear sensors, improved adhesives and smaller insertion systems are also important. Non-invasive glucose monitoring remains an emerging opportunity but requires substantial validation before it can displace established minimally invasive systems. In mature markets, technology adoption is increasingly determined by ease of use, reimbursement, data sharing and integration rather than sensor specifications alone. In emerging markets, lower manufacturing cost and simplified distribution are equally important. The result is a two-track innovation pathway: premium connected ecosystems in high-income markets and increasingly affordable, smartphone-compatible CGM products in broader patient populations.
By End User
Homecare is the largest end-user setting because CGM is designed primarily for continuous personal monitoring and because smartphone connectivity enables remote review by caregivers and clinicians. Hospitals and diabetes clinics remain important for diagnosis, initiation, education and management of complex cases, but recurring sensor use occurs largely outside institutional settings. Homecare is also the fastest-growing opportunity as reimbursement expands to additional patient groups and as CGM moves beyond intensive insulin users into broader Type 2 diabetes management. Country differences are pronounced. The U.S. has strong commercial and payer-driven adoption; Germany benefits from established healthcare coverage; Japan combines advanced healthcare infrastructure with an aging population; China has a large addressable diabetes population and expanding domestic device capabilities; Italy is supported by public healthcare and growing awareness; and South Africa faces affordability and access constraints that make lower-cost models particularly relevant. The next phase of market expansion will depend on reducing total cost, simplifying onboarding and linking home-generated data with clinical decision-making.
Competitive Landscape
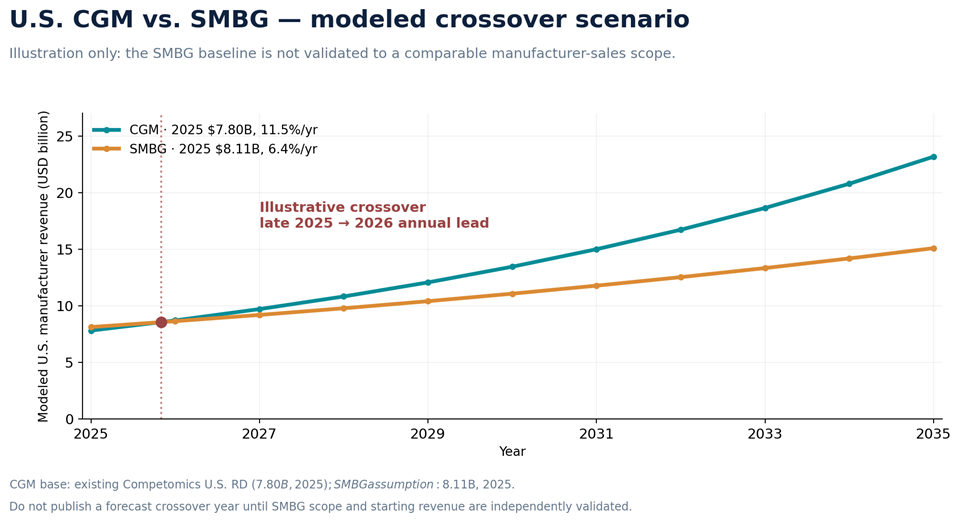
The competitive landscape includes multinational manufacturers and specialized technology companies, with Abbott, Dexcom and Medtronic among the most prominent participants in the analyzed market. Their position reflects combinations of installed product base, geographic reach, portfolio breadth, technology investment, distribution capabilities and ecosystem relationships rather than a single competitive factor. Abbott benefits from established scale and portfolio depth; Dexcom has a strong position in product innovation and market expansion; and Medtronic adds complementary capabilities in technology, delivery, monitoring or distribution. Competitive intensity is increasingly shifting from individual products to integrated ecosystems, where software, connectivity, recurring consumables, reimbursement access and clinical support influence customer retention. Smaller specialists and emerging manufacturers can compete through focused technologies, lower-cost models or partnerships. Recent strategic activity among leading participants has centered on product launches, technology integration, interoperability, partnerships and geographic expansion. For this report, the competitive-development chapter will track developments involving Abbott, Dexcom and Medtronic, including qualifying mergers, acquisitions, partnerships, collaborations, product launches, geographic expansions and major product updates. These developments are important because they indicate how leading companies are building ecosystems, extending product lifecycles and entering adjacent segments. Overall, the market is moving toward higher-value, technology-enabled solutions while established products continue to provide a large recurring revenue base. Through 2035, growth is expected to be shaped by affordability, broader access, interoperability, automation and data-driven care. Companies that combine reliable products with digital platforms, evidence generation and efficient distribution will influence the next phase of market development. CGM Versus Conventional SMBG: Manufacturer Revenue and Crossover The U.S. CGM market is undergoing a structural transition from episodic finger-stick glucose readings toward continuous sensor-based data streams. The Competomics working report currently estimates U.S. CGM revenue at USD 7.80 billion in 2025, with USD 23.15 billion by 2035 and an 11.5% CAGR for 2026–2035. These remain internal market assumptions pending validation against manufacturer domestic sales and a matched clinical-utilization model. Dexcom reported USD 3.3349 billion in U.S. revenue during 2025; Abbott's broader U.S. Diabetes Care revenue may be used only after its CGM component is isolated. The revenue model should also include MiniMed, Senseonics and smaller CGM suppliers, while excluding pumps and traditional SMBG products. The crossover between CGM and self-monitoring blood glucose (SMBG) requires a common revenue definition on both sides of the comparison. CGM encompasses continuous or intermittently scanned glucose-sensor systems and eligible related hardware, whereas SMBG comprises stand-alone finger-stick glucose meters, test strips and lancets. Payer reimbursement spending, retail outlays and net manufacturer sales are different measures and must not be mixed. A CGM patient may also purchase SMBG strips for backup measurements; market revenues are therefore not mutually exclusive by patient and an expenditure crossover is not the same as a crossover in the number of device users. One illustrative scenario compares the existing USD 7.80 billion Competomics 2025 CGM base, growing 11.5% annually, with a hypothetical USD 8.11 billion U.S. SMBG base growing 6.4% annually. Under these assumptions, the modeled continuous intersection occurs in late 2025, and CGM first exceeds SMBG on annual year-end values in 2026. This is only scenario arithmetic: the USD 8.11 billion SMBG benchmark is an externally published study estimate whose comparability to manufacturer-level revenue has not been established. The resulting intersection date is not evidence of an actual historical crossover. The modeled crossover can move substantially earlier or later depending on whether SMBG includes only conventional test strips and meters, whether revenue is measured at manufacturer or end-market prices, and whether SMBG volumes change as sensor adoption increases. Rising diabetes prevalence, backup testing needs, lower-cost glucose monitoring and incomplete CGM coverage may sustain SMBG demand even as CGM penetration expands. On the other hand, improved insurance coverage, non-insulin Type 2 adoption, lower-cost sensors and longer sensor wear may accelerate CGM adoption. For a publishable forecast, the base-year SMBG revenue should be rebuilt from meters, strip consumption and realizable manufacturer prices, followed by base, upside and downside scenario projections. The associated graphic should be labeled “illustrative scenario—revenue crossover not validated” until the SMBG base can be independently reconciled. A separate line chart showing CGM users versus SMBG-only users should not be derived from revenue totals, because adoption rates, per-patient annual expenditure and overlap between monitoring methods differ markedly. Together, these qualifications preserve analytical transparency while explaining the competitive transition between CGM and conventional monitoring.